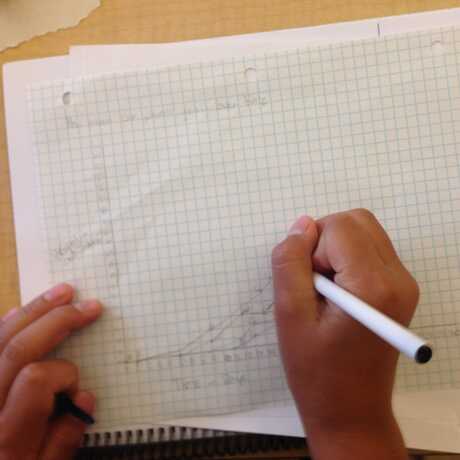
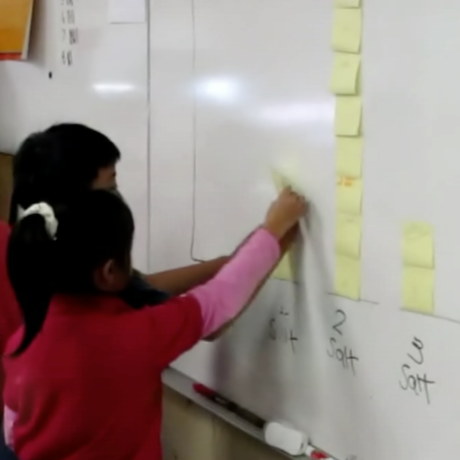
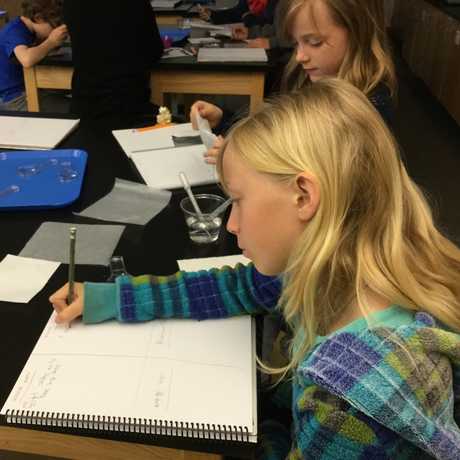
John loved doing a brine shrimp hatching experiment with his 4th graders. However, he didn’t like the data collection template provided by his curriculum; he felt it was too limiting for his students. Instead of using the template, he decided to make a giant bar graph on the board. He had his students place a post-it on the board if their bring shrimp hatched with 1 scoop of salt. He repeated the process with 2 scoops, 3 scoops, and so on. This strategy got his students up and moving, and involved them in co-constructing a class data table. Students could easily see that the bar of post-its for 2 scoops was significantly higher than the other categories. Because the students had supplied the data for the bar graph, they were more invested in the meaning-making. John, in the process, could hang back and let his students figure it out.

