Browse a rich array of educational resources from the award-winning show, Habitat Earth.
How does agriculture affect aquatic ecosystems?

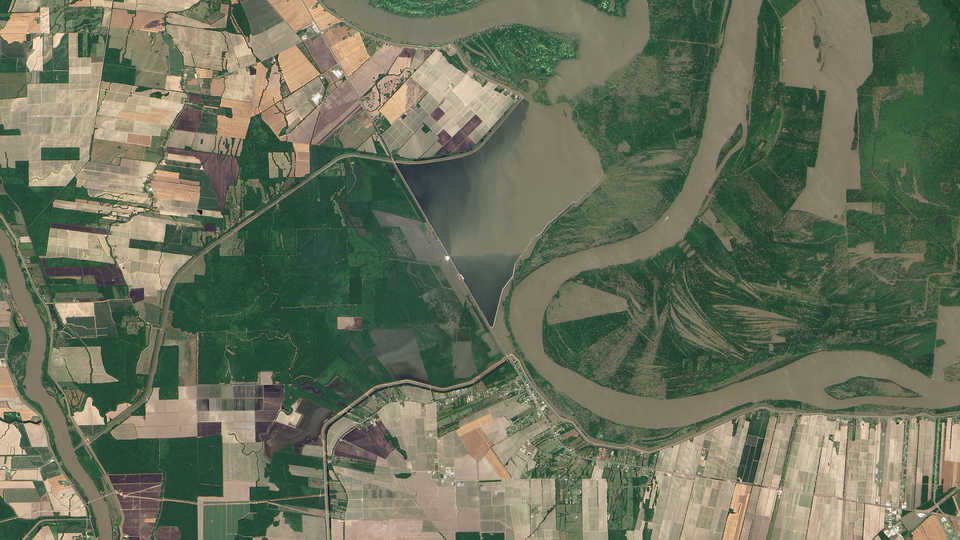
"Morganza Spillway" © 2011 NASA Earth Observatory
Can we use a model to predict the impacts of nutrient pollutants on an aquatic ecosystem? In this activity, students participate in a kinesthetic simulation to illustrate how nutrient pollution from agricultural runoff can lead to a dead zone at the mouth of a drainage basin.
How does agriculture affect aquatic ecosystems?
Students will

Tell the students that they are going to be a part of the model simulating eutrophication, and assign each student a role from the Model Role List, modifying them accordingly to accommodate your class size.
Pass out clipboards to the water quality monitoring station(s) and instruct students to go to their assigned locations (tributaries, stations, organisms).
Return to the classroom with at least 20 minutes remaining in the class period to wrap up the lesson.
Eutrophication is the process by which there is an increase in the availability of nutrients in an aquatic system that can result in increased algal growth. Eutrophication can occur both naturally or as a result of human activities such as agriculture that increases the level of nutrients in a body of water through fertilizer runoff. An excess of nutrients results in excessive algal growth, and bacterial decomposition of algae depletes oxygen available for other aquatic life. This can lead to very low or depleted dissolved oxygen conditions—hypoxia and anoxia, respectively—in the water column such that many marine organisms cannot survive. This is known as a ‘dead zone’ (NOAA, retrieved August 2015).
Eutrophication of nutrients --> Accelerated algal growth --> Decomposition of dead algae uses up available oxygen --> Dead zone near floor
Coastal regions near the outlets of drainage basins that drain agricultural lands are particularly affected by eutrophication as nutrients that enter smaller tributaries upstream become concentrated at the basin mouth, creating widespread dead zones. The Mississippi-Atchafalaya River Basin, the largest drainage basin in North America, drains over 1.2 million square miles of land area characterized by heavy agricultural use into the Gulf of Mexico. Hypoxic conditions near the seafloor at the mouth of this drainage basin are intensified in the late spring and summer as winds decrease and the water column becomes strongly stratified. Scientific research indicates that hypoxic conditions in the Gulf of Mexico have increased since the 1950s as a result of increased human activities like farming within the Mississippi-Atchafalaya River Basin (Osterman et al., 2005). In 2013, the dead zone off the coast of Louisiana was the size of Connecticut (NOAA, 2013).
Eutrophication and hypoxia have a significant impact on the diversity of species and food webs within aquatic ecosystems. Studies in the Gulf of Mexico specifically have found that the number of aquatic species that typically live within the sediment on the seafloor--and thus cannot easily escape low oxygen conditions--declines in a dead zone (Harper Jr. et al., 1981). A reduction in the biodiversity of an ecosystem means a reduction in important ecosystem services that keep the ecosystem healthy. Dead zones also have important economic impacts, affecting the productivity of fisheries and the people who rely on them for their livelihood.
Solving the problem of dead zones caused by human activities is not trivial, but has generally focused on reducing the amount of nutrients entering drainage systems from croplands (Rabotyagov et al., 2014). Nutrient pollution that contributes to the formation of dead zones is referred to as ‘nonpoint source pollution’ because it is difficult to trace the pollutants from where they end up back to their exact source.
Disciplinary Core Ideas (6-8)
Science and Engineering Practices (6-8)
Cross-Cutting Concepts (6-8)
Related Performance Expectations
Remember, performance expectations are not a set of instructional or assessment tasks. They are statements of what students should be able to do after instruction. This activity or unit is just one of many that could help prepare your students to perform the following hypothetical tasks that demonstrate their understanding:
MS-ESS3-4: Construct an argument supported by evidence for how increases in human population and per-capita consumption of natural resources impact Earth's systems.
Goldewijk, K.K., Beusen, A., & Janssen, P. (2010). Long term dynamic modeling of global population and built-up area in a spatially explicit way, HYDE 3 .1. The Holocene (20.4), 565-573.
Goldewijk, K.K., Beusen, A., van Drecht, G. & de Vos, M. (2011). The HYDE 3.1 spatially explicit database of human-induced global land-use change over the past 12,000 years. Global Ecology and Biogeography (20.1), 73-86.
Harper Jr., D.E., McKinney, L.D., Salzer, R.R., & Case, R.J. (1981). The occurrence of hypoxic bottom water off the upper Texas coast and its effect on the benthic biota. Contribution in Marine Science, 24, 53-79.
Louisiana Universities Marine Consortium (LUMCON) (n.d.). Hypoxia in the Northern Gulf of Mexico. Retrieved July 2015 from http://www.gulfhypoxia.net/overview/
NOAA (n.d.). Hypoxia. Retrieved August 2015 from http://oceanservice.noaa.gov/hazards/hypoxia/
Osterman, L.E., Poore, R.Z., Swarzenski, P.W., & Turner, R.E. (2005). Reconstructing a 180 yr record of natural and anthropogenic induced low-oxygen conditions from Louisiana continental shelf sediments. Geology, 33, 329-332.
Rabotyagov, S.S., Campbell, T.D., White, M., Arnold, J.G., Atwood, J., Norfleet, M.L., Kling, C.L., Gassman, P.W., Valcu, A., Richardson, J., Turner, R.E., and Rabalais, N.N. (2014). Cost-effective targeting of conservation investments to reduce the northern Gulf of Mexico hypoxic zone. PNAS 111.52, 18530-18535.
United States Geological Survey (2014) Eutrophication Definitions. Retrieved July 2015 from http://toxics.usgs.gov/definitions/eutrophication.html
Image: Morganza Spillway, NASA Earth Observatory image by Jesse Allen and Robert Simmon, using EO-1 ALI data; originally sourced from https://earthobservatory.nasa.gov/images/50623/morganza-spillway-opens-in-louisiana. Image is freely available for re-publication or re-use, including commercial purposes. NASA requests that NASA’s Earth Observatory be given credit for its original materials; the only mandatory credit is NASA. Credit given to this image is: NASA Earth Observatory image by Jesse Allen and Robert Simmon, using EO-1 ALI data.
Browse a rich array of educational resources from the award-winning show, Habitat Earth.