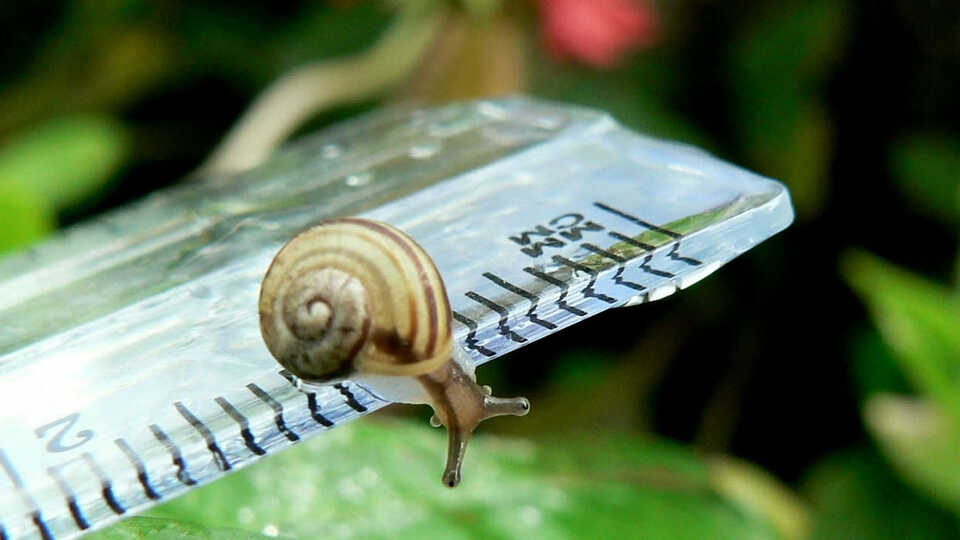
snail on ruler

"He's too tiny to measure up." © 2006 Patty O'Hearn Kickham

0

Some organisms, like whales and redwood trees, are so large that it's hard for us to picture just how big they are!  In this lesson, students practice mathematics and computational thinking to create scale models of themselves, and then apply these skills to create models of other large organisms. This activity works best when stretched out over three (or more) class periods.

Objectives

In this lesson, students will:

  1. learn to make and interpret scale models.
  2. practice using the metric system for measurement.
  3. discover the relative sizes of various large plants and animals.
Materials
  • cardstock and/or poster paper
  • butcher paper
  • metric rulers and meter sticks (one per group)
  • sidewalk chalk
  • How Big is Big Worksheets (1 per student) –OR-
  • students will need their science notebooks
Educator Prep
  1. Gather the necessary supplies.
  2. A worksheet is provided to help structure students’ calculations. If you choose to use this worksheet, make one copy per student. If you don’t want to use the worksheet, decide how you will have students structure their notes and record their calculations in their science notebooks.
Introduction
  1. Introduce the activity by discussing what a scale model is.
    • What is a scale model?
    • What are some examples of scale models?
    • Why do we use them? How are they helpful?
       
  2. Tell students that they will be creating models based on a scale of 1:10. This means that 1 cm of length on the model represents 10 cm of length on the real organism. (The 1:10 scale was selected because it is easy to work with mathematically, and because most of the models produced will be a good size for displaying in the classroom. If you want to challenge your students with more difficult calculations, you can choose a different scale, or follow this with other activities using more challenging scales.)
     
  3. Ask students: If we are using a 1:10 scale, and the model is 5 centimeters long, how long must the real thing be? (50 centimeters.)
    • How did you figure that out? (multiply by 10)
       
  4. Ask students: If you knew the length of the real thing, how would you figure out the length that the model would be? (divide by 10.)
     
  5. If you are using the worksheet, have students record this information in the appropriate places.
    • They should circle “multiply by 10” for converting from the model to the real organism.
    • They should circle “divide by 10” for converting from the real thing to the model.
    • On the Real Organism to Model table, students should fill in “÷10” in the conversion column.
    • On the Model to Real Organism table, they should fill in “x10” in the conversion column.
Procedure Part One: Mini-Me

Students will create scale models of themselves to use as a point of reference in the later activities. These can also be used to demonstrate the concept of relative size.

  1. Have students pair off and use meter sticks to measure each other’s heights. Students will record their height in the first line of the table on their worksheet, as shown on page 2.
     
  2. After recording their actual height in the “Measurement from the Real Organism” column, they will then perform the conversion (÷10) to find the measurement for the model.
     
  3. Now that students know how tall their “mini-me” model should be, they can create the model by drawing a silhouette of the appropriate size on cardstock.
     
  4. After students cut out their silhouettes, allow them to decorate and personalize their models so they will be able to recognize which one is theirs.
     
  5. Have students compare their mini-me models with those of their classmates to illustrate the concept of relative size. While the models are obviously not the same actual size as the students, they should be the same relative size when compared to each other. For example, if two students are the same height, their models should be the same height. If one student is taller than another, the taller student’s model should be taller than the shorter student’s model. (Note that at this scale, size differences may be subtle. The more precise the models are, the easier it will be to see the differences.)
Procedure Part Two: How Big is Big?

Students will create models of some of the largest animals currently living.

  1. Divide students into as many as 7 groups. Assign each group one of the following animals to model:
    • the largest living mammal (overall)
    • the largest living land mammal
    • the largest living reptile
    • the largest living amphibian
    • the largest living bird
    • the largest living bony fish
    • the largest living cartilaginous fish
      (If you have fewer than 7 groups, choose a subset of the above categories. Note that these animals are all vertebrates. Invertebrates tend to be smaller and make less impressive models; however, you can add some invertebrate groups if you wish.)
       
  2. Discuss the characteristics that define animals in each category. (For example, mammals are characterized by fur, live birth, and mammary glands.) Have students predict which animals they think will be the largest.
     
  3. Ask students what criteria could be used to determine what animal is the largest. Possibilities include length, height, volume, or weight. Using different criteria can give different results. For example, one animal could be longer but weigh less than another animal.
     
  4. Explain that, in order to keep results consistent, we will be using length and height to define the largest animal in each category, not volume or weight.
     
  5. Groups must now research their category in order to find the necessary information. They need to know what species is the largest in the category, the length and height of the animal, and what it looks like.
     
  6. When students have gathered all the relevant information, they can use the table on their worksheets to determine how big their silhouette models should be. See page 4 for an example.
     
  7. Once students have calculated how big their model should be and found pictures to get an idea of what the animal looks like, they can create the model by drawing a silhouette of the appropriate size on poster paper or, for the larger animals, butcher paper. Note that some of the models may require a few pieces of paper taped together to get the required size! (The blue whale in particular will be very large and may be a bit unwieldy.)
     
  8. Have students cut out and color the silhouettes. When they are finished, display the models in the classroom, either by hanging them on the wall or laying them flat on tables (or on the floor, in the case of the whale).
     
  9. Students should display the group members’ mini-me models next to the animal model the group created. If desired, you can also require them to display a sign with basic information about the animal that they gathered during their research.
     
  10. Give students time to go around the room and check out the models made by the other groups. Since all the models were made on the same scale, comparing between models will give a real sense of the relative size of the animals. These comparisons can in some cases be quite surprising. As students look at the model students next to the model animal, have them try to imagine what it would be like to be a real-size person standing next to the real-size animals.
     
  11. By this point students should be comfortable with calculating the appropriate model size based on the size of the real thing. Now they can use their peers’ models to practice the reverse calculation. Have students choose 2 or 3 of the models created by other groups and measure their dimensions. They can then use the table on the second page of the worksheet to calculate the size that the real animal would be. See the table on page 6 for an example.
Procedure Part Three: General Sherman is How Tall?!?

So far we have been focusing on large animals. In the final part of the activity, students will see how these animals compare to the largest plants in the world.

  1. Ask students to predict how they think the largest plants in the world would compare to the largest animals. Would the largest plants be larger than the blue whale? Smaller than the elephant?
     
  2. In the previous activities, we only considered length and height as criteria for largeness. In this activity, we will look at both the largest plant based on height and the largest plant based on volume.
     
  3. Tell students that the largest living plant species based on volume is the Giant Sequoia. Based on height, the tallest living plant species is the Coast Redwood.
     
  4. The largest known individual Giant Sequoia (measured by volume) is a tree named “General Sherman,” located in Sequoia National Park. This tree is 83.8 meters tall and 11.1 meters wide at the base.
     
  5. The tallest known individual Coast Redwood is named “Hyperion,” This tree measures 115.6 meters tall and 15.9 meters wide at the base. (Another Coast Redwood, the “Lost Monarch,” is larger by volume, though smaller than General Sherman.) Interestingly, Hyperion was discovered fairly recently in 2006, and its exact location is a secret.
     
  6. Give students the measurements of the General Sherman and the Hyperion. Have them calculate what the measurements should be for a model on the 1:10 scale.
     
  7. A butcher paper silhouette of this size would be rather difficult to construct and unlikely to fit comfortably in the classroom. Tell students that instead, they will be going outside to model these two trees by drawing them on the ground with chalk.
     
  8. Take students out to an area on the sidewalk or school yard where there is enough space to draw these two outlines. Bring along sidewalk chalk, meter sticks, and the animal and human models. (You may also need paperweights or rocks to prevent the models from blowing away.)
     
  9. Break the class into two teams and assign each team a tree. Give them time to measure out the appropriate areas and draw the trees. Have them label the drawings with the name of the tree, the species, and “1:10 scale.”
     
  10. Once the trees have been drawn, have students lay out the animal models and mini-me models next to the trees to see how they compare.
Wrap-Up
  • Ask your students to share about anything that may have surprised them during the course of this activity. Did the relative sizes of the organisms match their expectations?
  • The students created scale models to practice their math, but what are some other uses for them?
  • What are some other ways you could use scale models besides modeling length and height? Could you model weight or volume? Could you model time?
Extensions

This activity focused specifically on species that are currently living. However, there are many other large things that are worthy of a scale model. For an additional classroom or homework assignment, have students research and make scale models of:

  • Extinct animals (largest dinosaur, land mammal, aquatic animal, etc.)
  • Geologic features (mountains, volcanoes, craters, trenches, etc.)
  • Ancient structures (Egyptian Pyramids, Colosseum, Great Wall of China, etc.)
  • Modern structures (Eiffel Tower, Empire State Building, Golden Gate Bridge, etc.)
  • Celestial bodies (planets, comets, etc. – aligns with Performance Expectation MS-ESS1-3)
Background for Educators

We frequently read or hear some impressive statistics about large organisms—for example, that blue whales can be up to 30 meters long, or that the Giant Sequoia can grow as tall as 80 meters. However, when students read facts like this, it can be difficult for them to visualize what those numbers actually mean. In fact, size and scale in general can be difficult for students to grasp, especially when working with units that they may not be completely familiar with. In this activity, students will practice using the metric system for measurement and get comfortable with the concept of scale models. In addition, after creating models of different organisms, students will be able to clearly visualize the sizes of some of the world’s largest living plants and animals.

While the question of “which animal is the largest?” may seem fairly simple, the answer is not always straightforward. Size can be measured in many ways, such as by length, by volume, or by mass, and the results may differ depending on which criteria are used. For example, one animal may be longer but have a smaller volume than a second animal. For the sake of consistency, we will use the same criterion throughout most of this activity: length. Because the students will be making two-dimensional models, this will be an easy measurement to work with.

In addition to hands-on experience with size and scale, students will also gain experience with simple research as they look up the necessary facts about the animal they are modeling. This is a good opportunity for your students to practice locating and recognizing reputable sources of information. (Try to steer them away from depending solely on Wikipedia and toward more reliable resources.)

California State Content Standards

Grade Six

Mathematics: Algebra and Functions

  • 2.1 Convert one unit of measurement to another (e.g. from feet to miles, from centimeters to inches).

Grade Seven

Science: Investigation and Experimentation

  • 7b. Use a variety of print and electronic resources (including the World Wide Web) to collect information and evidence as part of a research project.
  • 7d. Construct scale models, maps, and appropriately labeled diagrams to communicate scientific knowledge (e.g., motion of Earth’s plates and cell structure).

Mathematics: Measurement and Geometry

  • 1.2 Construct and read drawings and models made to scale.
Next Generation Science Standards

Scientific and Engineering Practices

  • Developing and Using Models: Develop or use a model to describe phenomena.
  • Using Mathematics and Computational Thinking: Apply mathematical concepts and processes (such as ratio, rate, percent, basic operations, and simple algebra) to scientific and engineering questions and problems.

Cross-Concepts

  • Scale, Proportion, and Quantity: Time, space, and energy phenomena can be observed at various scales using models to study systems that are too large or too small.
  • Systems and System Models: Models are limited in that they only represent certain aspects of the system under study.

Performance Expectations

  • MS-ESS1-3: Analyze and interpret data to determine scale properties of objects in the solar system. This is only applicable if celestial bodies are covered in an extension.
References

Save the Redwoods League: Giant Sequoias. Retrieved on June 16, 2015.

Save the Redwood League: Coast Redwoods. Retrieved on June 16, 2015.

National Parks Service: The General Sherman Tree. Retrieved on June 16, 2015.

Humboldt County Convention and Visitors Bureau: Hyperion. Retrieved on June 16, 2015.

Image: "He's too tiny to measure up." by Patty O'Hearn Kickham, licensed and modified under CC BY 2.0; originally sourced from https://www.flickr.com/photos/memotions/259656126

Appropriate for: 6th Grade - 12th Grade
Standards for: 6th Grade, 7th Grade, 8th Grade, 9th Grade, 10th Grade, 11th Grade, 12th Grade
Prep Time: 15 minutes
Activity Time: 135 minutes
Subjects: Life Science, Scale, Proportion, & Quantity

Attached Files