Browse a rich array of educational resources from the award-winning show, Habitat Earth.
How might primary productivity on land and in the oceans be related to the migration patterns of turkey vultures and ospreys?

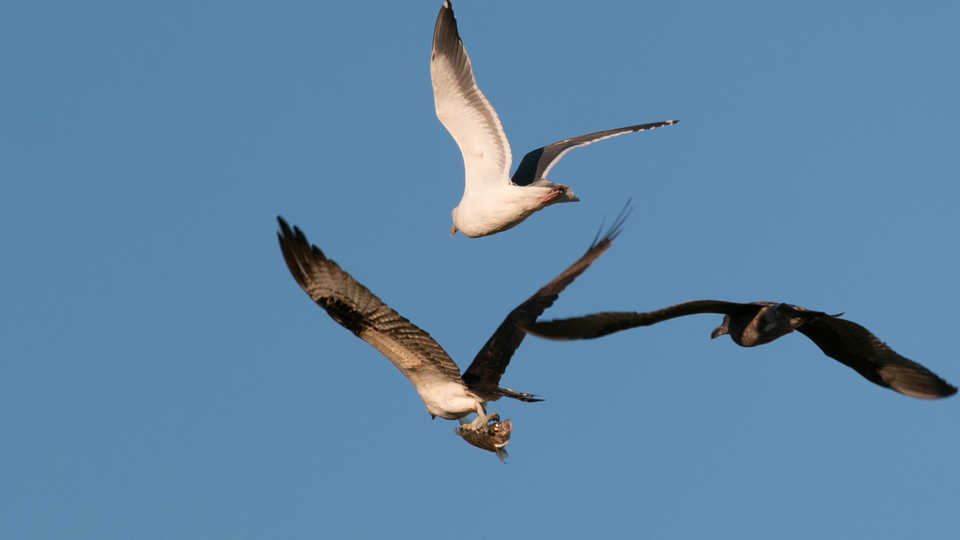
"Osprey with Gulls" © 2014 Lee Jaffe
Why do birds migrate? How do seasonal changes in primary productivity influence the behaviors of higher order consumers like raptors? Visualize and explore the connectedness of organisms within and across ecosystems in this teacher-guided activity.
How might primary productivity on land and in the oceans be related to the migration patterns of turkey vultures and ospreys?
Students will

Prior to this exercise, students should have some basic, but not necessarily extensive, knowledge about ecosystems, ecology, and seasonality. This activity can be used either as an introduction to a unit on ecosystems, ecosystem dynamics (trophic structures and interactions), and productivity, OR it can be used as an activity in the middle or at the end of the unit to give students practice applying their knowledge and making connections between concepts.
In this activity, the teacher will show students a short visualization clip (in segments) of raptor migrations between North and South America and will guide students in constructing hypothesis and logical explanations using empirical scientific data. Students will reflect upon and engage in discussions with their classmates after watching each clip segment, as outlined in the Activity below.
The numbered questions listed in italics under the Activity outline below are the same questions that are on the Student Worksheet provided.
Give your students a few minutes to reflect individually on their student worksheets OR in their notebooks after watching each clip segment, then discuss the questions as a class.
CLIP SEGMENT 1: 0:00-0:35
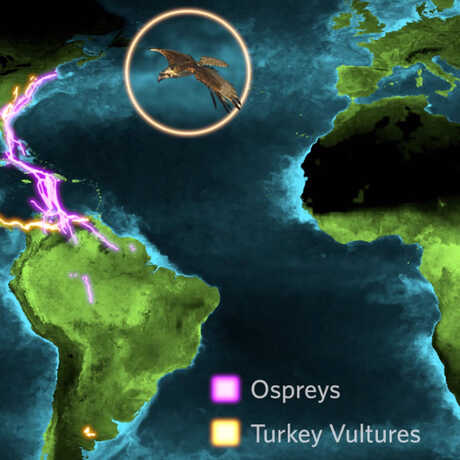
In this initial segment of the visualization, we are seeing what appears to be geographical movement of something between North and South America, but we don’t know what this movement represents. We can also see two colors of motion, meant to distinguish between two things, but again we don’t know what it is distinguishing.
1. What might this visualization be representing or showing, and why?
CLIP SEGMENT 2: 0:35-0:52
This segment should establish that the video is indeed showing migrations of two different animals (in this case, two different raptors). In addition to being shown this information in a legend, we’re also given new information that we’re seeing geographic movements of these birds through time, as indicated by the changing months displayed on the screen.
This segment will likely need to be replayed once or twice, with students addressing the following questions individually after watching and re-watching the segment:
2. How accurate was your initial hypothesis?
3. Do you expect to see any patterns in the movement of the raptors through time?
4. (After replay) Do you see any patterns in the movement of the raptors through time?
5. What might account for the timing of the birds’ migrations? What might you expect the pattern of the migrations be over the rest of the year?
CLIP SEGMENT 3: 0:52-1:15
In this segment we get to see migration patterns for the rest of the year. We are also given a new piece of information—the colors on the surface of the earth in the video relate to the amount of carbon being absorbed in that region.
6. What (process) is carbon absorption a measure of?
This question can lead into a discussion about primary productivity and photosynthesis that is as extensive as you want it to be. You can just talk qualitatively and generally about photosynthesis, or you can actually write down the chemical equation for photosynthesis and discuss it in more detail. Students should be able to describe how photosynthesis uses carbon dioxide, and thus how we can measure the rate of photosynthesis by measuring the amount of carbon absorption.
7. Does there appear to be a correlation between the movements of the raptors and changes in carbon absorption in these regions?
CLIP SEGMENT 4: 1:15-1:47
There is no new information presented in this segment, but you can use it to reiterate what has already been discussed and to see further how carbon absorption changes with the seasons in the hemispheres.
8. How might carbon absorption on land and in the oceans be related to the migration patterns of turkey vultures and ospreys?
If the students do not know much about these two types of birds, they might say incorrectly that the birds feed on the primary producers. If none of the students know that raptors are birds of prey (predators of other animals), then this might be a good time for a brief introduction to raptors.
These last two video segments should ultimately lead to a discussion about (a) Carbon absorption as a measurement of primary productivity and the importance of primary producers as the foundations of trophic structures (needed by the creatures that raptors eat), (b) Seasonality and how it affects primary productivity geographically, and (c) Why seasonality usually drives animal migrations (animals follow their food!).
The ultimate goal of this exercise is for the students to be able to analyze, interpret, and integrate the data presented in this science visualization clip to describe the seasonal migration habits of ospreys and turkey vultures and what might be driving them. The goal is also for them to be able to describe how we can use empirical data to gain knowledge about the natural world.
You can wrap up this activity with the following two student questions, or extend it with any of the extensions listed below.
9. Write a brief summary of the information presented in the video clip. How did your preexisting knowledge help you with forming hypotheses throughout this exercise?
10. The scientific data you analyzed in this video clip (raptor migration patterns and carbon absorption) are what we call ‘empirical’ data, or data/knowledge that we’ve acquired through experimentation and observation. How do you think scientists obtained the empirical data used in this visualization? What other empirical data might be useful for further analyzing the migration habits of these two raptors?
Migration patterns of species can provide valuable insight into the stability of various ecosystems. The migration patterns of ospreys and turkey vultures throughout North and South America are illustrated in this video. Nearly all of the osprey and turkey vulture populations shown in this video follow the same migratory patterns, regardless of their specific breeding and wintering grounds. These raptors nest and breed in their northern most location during the spring and summer months. As the seasonal changes of fall approach, raptors begin their annual southern migration to their respective wintering grounds. After approximately five months in their winter locations, ospreys and turkey vultures begin to migrate northward to their original nesting grounds (Shane, 2014). While scarcity of food during the winter season is often considered the primary cause of southward raptor migration in the fall, this video provides a closer look at the relationship between raptor migration, food availability, and net primary productivity (NPP). Specifically, it illustrates the connection between primary producers and higher order members of a food chain/web. While raptors don’t feed directly on primary producers, they do feed on the primary consumers who rely on the producers.
In addition to raptor migration patterns, the video illustrates changes in carbon absorption on land and in water, referred to as net primary productivity (NPP). Through photosynthesis, plants take in CO2 and convert carbon into sugar molecules (carbohydrates) using water and energy from the sun (NASA, 2015). This process occurs in land plants, in algae, and in other primary producers of our oceans, such as microscopic phytoplankton. Although CO2 is broken down during photosynthesis, some CO2 is released back into the atmosphere as plants respire. The amount of CO2 taken in by vegetation during photosynthesis minus the amount of CO2 put out during respiration equals NPP, or the total amount of CO2 absorbed by plants (NASA, 2015):
CO2 taken in – CO2 respired out = Total CO2 absorbed by vegetation = Net Primary Productivity (NPP)
The chemical reaction by which plants produce complex food molecules requires an energy input from sunlight to occur. On land and in the ocean, the availability of light from the sun limits the amount of energy plants can use for photosynthesis, in turn limiting the amount of CO2 they are able to take in. The seasonal variability of light and its effect on net primary production is illustrated in this video. An increase in NPP is reflected in both the Northern and Southern Hemispheres during their respective summer months. An increase in the availability of sunlight allows plants to photosynthesize at a faster rate, increasing the amount of CO2 being absorbed from the atmosphere and raising NPP (NASA, 2015).
As these plants take in carbon for food and fuel, they continue to grow and eventually become a food source for consumers higher on the food chain (National Wildlife Federation, 2015). All successful food chains must begin with producers, such as plants or algae that can synthesize carbohydrates through solar and chemical energy. As apex predators, raptors generally do not rely directly on plant matter as a food source, but the fish, small mammals, and prey birds they feed on do. The more producers available for fish, small rodents, and prey birds to consume means an increase in the amount of food available to osprey and turkey vulture communities.
This video illustrates the correlation between raptor migration patterns and carbon absorption on land and in water. Raptor flight patterns are aligned very closely with seasonal changes in NPP. As winter approaches and NPP decreases in their breeding locations, ospreys and turkey vultures migrate south in search of food where NPP is higher during these months.
Disciplinary Core Ideas (6-8)
Science and Engineering Practices (6-8)
Crosscutting Concepts (6-8)
Ocean Productivity:
Behrenfeld, M.J., O’Malley, R.T., Siegel, D.A., McClain, C.R., Sarmiento, J.L., Feldman, G.C., Milligan, A.J., Falkowski, P.G., Letelier, R.M., & Boss, E.S. (2006). Climate-driven Trends in Contemporary Ocean Productivity. Nature, 444, 752-755.
Land Productivity:
NASA MODIS Land Science Team
Bird Tracking Data:
Dodge, S., Bohrer, G., Bildstein, K., Davidson, S.C., Weinzierl, R., Bechard, M.J., Barber, D., Kays, R., Brandes, D., Han, J., & Wilkelski, M. (2014) Environmental drivers of variability in the movement ecology of turkey vultures (Cathartes aura) in North and South America. Phil. Trans. R. Soc. B, 369, 1-17. http://rstb.royalsocietypublishing.org/content/369/1643/20130195
Image: "Osprey with Gulls" by Lee Jaffe, licensed and modified under CC BY-NC-SA 2.0; originally sourced from https://www.flickr.com/photos/ldjaffe/15921095877/in/photolist-pAjbPA-qxf4w5-qfTM84-qv2Fih
Food Webs and Bioaccumulation. (n.d.) Retrieved May 2015 from http://www.nwf.org/Wildlife/Wildlife-Conservation/Food-Webs.aspx
Global Maps: Chlorophyll and Net Primary Productivity. NASA Earth Observatory. Retrieved May 2015 from http://earthobservatory.nasa.gov/GlobalMaps/view.php?d1=MY1DMM_CHLORA&d2=MOD17A2_M_PSN
Global Maps: Net Primary Productivity. NASA Earth Observatory. Retrieved May 2015 from http://earthobservatory.nasa.gov/GlobalMaps/view.php?d1=MOD17A2_M_PSN
Net Primary Productivity (1 Month- TERRA/MODIS). NASA Earth Observations. Retrieved April 2015 from http://neo.sci.gsfc.nasa.gov/view.php?datasetId=MOD17A2_M_PSN
Raptors of the World. Raptor Research Foundation. Retrieved July 2015 from http://www.raptorresearchfoundation.org/education/raptor-world
Shane, Ken (2014). Osprey Expert Talks About Migratory Patterns of Raptor. The Jamestown Press. Retrieved July 2015 from http://www.jamestownpress.com/news/2014-04-24/News/Osprey_expert_talks_about_migratory_patterns_of_ra.html
Browse a rich array of educational resources from the award-winning show, Habitat Earth.