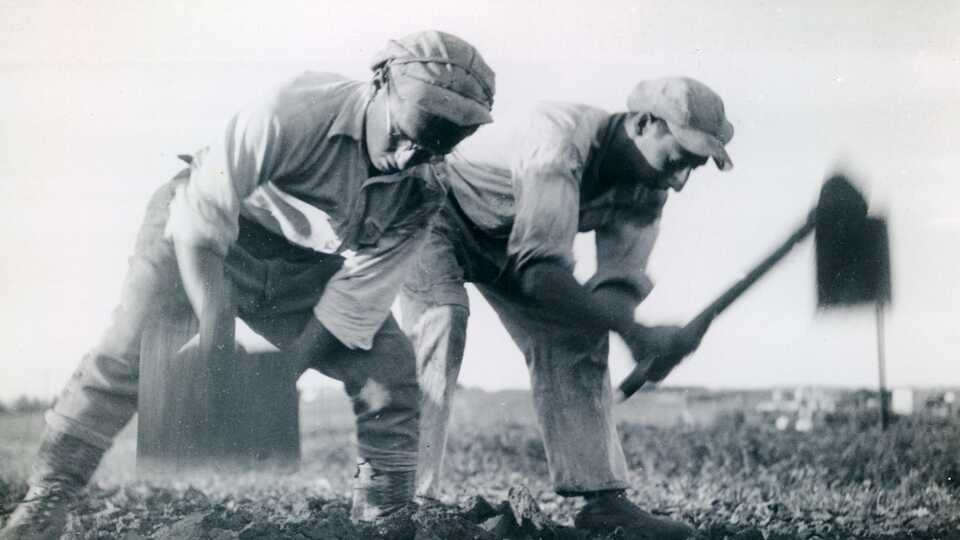
two men plowing
0

Trace patterns of agricultural expansion through space and time, especially as they relate to climate and geography. How are patterns of human settlement and human population growth linked? Do you see evidence for how agriculture spread and retreated from different places based on historical events?

Essential Question

How are patterns of human settlement and human population growth linked to how land has been used for agriculture?
Objectives

After this activity, students will be able to
  1. Trace patterns of agricultural expansion through space and time, especially as they relate to climate and geography, and locate such expansion on a map or timeline.
  2. Explain how agriculture is linked to population growth and migration across the globe over time.
  3. Present claims and findings, using multimedia components and visual displays to clarify information.
Materials
Agricultural spread
Educator Prep
  1. Test the video quality on your school’s internet connection. Note that you can click the Settings cog in the footer to adjust the Quality to up to 1080HD, and you can also toggle on Full Screen.
     
  2. Note that this the video depicts changes in agricultural systems from 1200CE to 1996 CE. Think about how the use of this clip relates to your curriculum. You can use the time ticker to remember key points in time for pausing to make detailed observations.
     
  3. Consider what format would work best for your student presentations. Suggestions include a poster, a PowerPoint or Prezi presentation, a paper flow chart, a hand drawn map with a legend, a series of maps depicting change over time. Consider using a presentation rubric.
     
  4. This activity assumes a focus on the overlap between where large populations arose and the spread and patterns of agriculture, connecting this to the natural climate and geography of the area. However, you may design your activity as best fits your unit. Need ideas? Scroll to the History and Social Studies standards below. The clip may also be a particularly good resource for these questions: 
    • How are human population centers and areas of agricultural use related in space and time? Does, for instance, agriculture expand out from city-centers? Which comes first—a cluster of humans and then agriculture, or vice versa? 
    • Are there time periods when the spread of agriculture moved at a quicker pace than others? Why? 
    • Are there places where the spread of agriculture moved at a quicker pace than others? Why? 
    • How do the patterns of human population and migration across North America correlate to the patterns of agriculture expansion? How is this related to periods of migration from Europe? 
    • Do you see evidence for how agriculture spread and retreated from different places based on historical events? Where else do you see expansion and retraction, and why?
Terms for Students
  • agriculture: the production of crops, livestock, or poultry; farming
  • climate: the average, long-term conditions of temperature, precipitation, winds, and clouds in an area
  • civilization: a human society that has highly developed material and spiritual resources and a complex cultural, political, and legal organization; an advanced state in social development
  • society: a highly structured system of human organization for large-scale community living that normally furnishes protection, continuity, security, and a national identity for its members
  • population: the number of inhabitants of a place, or belonging to a specific social, cultural, socioeconomic, ethnic, or racial subgroup
  • migration: the process of moving from one country, region, or place to another
  • geography: the study of the natural features of the earth's surface, including topography, climate, soil, vegetation, etc, and man's response to them
Introduction
  1. Show students the How Did Human Civilization Spread? clip, and ask them to describe what they notice. Watch through the clip entirely 3-4 times, then focus in on a time period most appropriate for your classroom content.
     
  2. Accept all student observations, and using those, form questions for a subsequent task. Or, lead them to the focus previously chosen as appropriate for your grade level unit.
     
  3. Divide students in working groups. Remind students that you will be focusing on a particular time period and a particular geographical region.
Using Data to Tell a Story

Small group task: using reliable information sources of your choice and integrating the selected temporal /geographic section of the clip, create a presentation tracing patterns of agricultural expansion and population growth through space and time, constructing explanations for how these patterns relate to climate and geography. Your presentation must:

  1. Tell a compelling story in under 5 minutes, using any format. A successful story using data as evidence should
    • point out patterns that you see in the data;
    • pose an interesting question that the data prompt or that the data can answer (“I wonder…,” “I notice…,” “The data appear to show…”);
    • answer questions using reliable information sources and the clip itself (I know this because…,” “I conclude…,”; and
    • point to further research (“I still have these questions…,” “An alternative explanation or story might be…”)
    • be clear about the sources used.
  2. (Example for this particular focus) Your story should also include:
    • background research that you compile that describes the geography, landscape, and climate of the area of focus. This information is not contained in the clip, so you will need to use the atlases and online resources to assemble this.
    • an explanation of how geography, landscape, and climate influenced the presence/growth/decline of agriculture in your area and your time; and what kind of agriculture is/was there.
    • a description of the pattern of human settlement in your geographic and temporal area of focus. Use atlases and online sources to research numbers, who lived there, when they got there, why they moved there, and why population went up or down.
    • a bibliography of sources used.
Class Discussion

Following the small group presentations, pull together the class to discuss an overarching trend, or stimulate further discovery. For example:

  • Discuss the ways in which humans changed the natural environmental to make it suitable for the type of agriculture that existed in your selected region and time.
  • Discuss how the advent of agriculture has changed human societies and our environment, for better and for worse.
Extensions

Science teachers may be interested in having students brainstorm what types of additional questions could be answered directly using the data from this clip. Topics might include:

  • climate change
  • freshwater resources (groundwater depletion and water quality)
  • land cover change/destruction of habitats and ecosystems
  • technology
  • human population carrying capacity
  • nutrient loading and “dead zones” (see: From Farms to Phytoplankton activity)

Educators interested in maps created via large-scale data sets can dive deeply into the ways humans have transformed the biosphere by visualizing the Anthromes 2 Maps in either Google Maps or Google Earth.

Background for Educators

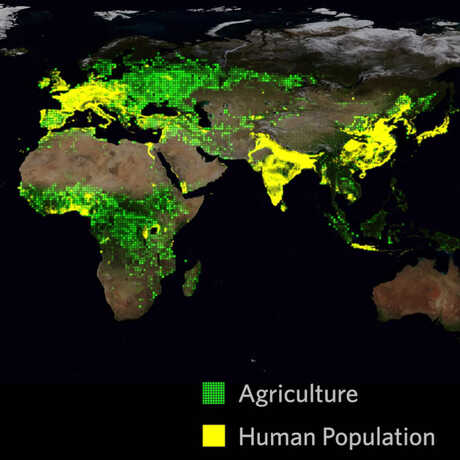
How Did Human Civilization Spread? depicts the growth and development of population centers in North America during the time period 1200 CE and 1996 CE. These data are contrasted with the geographic range and expansion of agriculture across the globe during the same time period. These data have been compiled from an extensive data set, simplifying the data for a global visualization by using larger grid blocks whose brightness indicates the intensity of land use or population density. Note that the green agriculture grid blocks include both agriculturally developed areas for crops and pasture used for animal grazing.

For additional background, please see:

Feeding 9 Billion
This resource is National Geographic’s ongoing series about food and agriculture. The article above talks about some of the design solutions and policy changes we will need to implement to sustainability support the Earth’s burgeoning population.

Next Generation Science Standards

Disciplinary Core Ideas (6-8)

  • MS-ESS3.A: Natural Resources: Humans depend on Earth’s land, ocean, atmosphere, and biosphere for many different resources. Minerals, fresh water, and biosphere resources are limited, and many are not renewable or replaceable over human lifetimes.

Science and Engineering Practices (6-8)

  • Obtaining, Evaluating, and Communicating Information: Communicate scientific and/or technical information (e.g. about a proposed object, tool, process, system) in writing and/or through oral presentations.

Cross-Cutting Concepts (6-8)

  • Stability and Change: Students explain stability and change in natural or designed systems by examining changes over time.
  • Cause and Effect: Cause and effect relationships may be used to predict phenomena in natural or designed systems.
California History and Social Studies Standards

The following list include potential topics listed in the History and Social Studies content standards for which the above visualization may serve useful, even as a “hook” to capture students attention for a new unit of study.

Grade 6

Paleolithic Era to Agricultural Revolution

  • Locate and describe the river systems and physical settings supported civilizations in Mesopotamia, Egypt, Kush, and India.
  • Trace the development of agricultural techniques that permitted the production of economic surplus and the emergence of cities as centers of culture and power in Mes, Eg, Ku.

Grade 7

Medieval and Early Modern Times (500-1789 AD)

  • Identify the physical features and describe the climate of the Arabian peninsula, its relationship to surrounding bodies of land and water, and nomadic and sedentary ways of life.
  • China in the Middle Ages: Describe agricultural, technological, and commercial developments during the Tang and Sung periods.
  • Study the Niger River and the relationship of vegetation zones of forest, savannah, and desert to trade in gold, salt, food, and slaves; and the growth of the Ghana and Mali empires.

Grade 8

United States: Early Growth: 1750s-1850s

  • Trace patterns of agricultural and industrial development as they relate to climate, use of natural resources, markets, and trade and locate such development on a map.
  • Discuss the influence of industrialization and technological developments on the region, including human modification of the landscape and how physical geography shaped human actions (e.g., growth of cities, deforestation, farming, mineral extraction).
  • Describe the development of the agrarian economy in the South, identify the locations of the cotton-producing states, and discuss the significance of cotton and the cotton gin.

Grade 9-10

Modern World History: late 1700s to present

  • Describe the growth of population, rural to urban migration, and growth of cities associated with the Industrial Revolution.
  • Nation-building in the Middle East, Africa, Mexico, and other parts of Latin America, and China. Describe the recent history of the regions, including political divisions and systems, key leaders, religious issues, natural features, resources, and population patterns.

Grade 11

United States: 1900s

  • Discuss the diverse environmental regions of North America, their relationship to local economies, and the origins and prospects of environmental problems in those regions.
  • Discuss the rise of mass production techniques, the growth of cities, the impact of new technologies (e.g., the automobile, electricity), and the resulting prosperity and effect on the American landscape.
  • Discuss the human toll of the Depression, natural disasters, and unwise agricultural practices and their effects on the depopulation of rural regions and on political movements of the left and right, with particular attention to the Dust Bowl refugees and their social and economic impacts in California.
  • Describe the significance of Mexican immigration and its relationship to the agricultural economy, especially in California.
  • Describe the effects on society and the economy of technological developments since

1945, including the computer revolution, changes in communication, advances in medicine, and improvements in agricultural technology.

  • Explain how the federal, state, and local governments have responded to demographic and social changes such as population shifts to the suburbs, racial concentrations in the cities, Frostbelt-to-Sunbelt migration, international migration, decline of family farms, increases in out-of-wedlock births, and drug abuse.
California Environmental Principles and Practices
  • Principle I: The continuation and health of individual human lives and of human communities and societies depend on the health of the natural systems that provide essential goods and ecosystem services.
    • Concept a: Students need to know that the goods produced by natural systems are essential to human life and to the functioning of our economies and cultures.
  • Principle III: Natural systems proceed through cycles that humans depend upon, benefit from, and can alter.
    • Concept b: Students need to know that human practices depend upon and benefit from the cycles and processes that operate within natural systems.
Common Core English Language Arts

Integration of Knowledge and Ideas:

CCSS.ELA-LITERACY.RI.6.7

Integrate information presented in different media or formats (e.g., visually, quantitatively) as well as in words to develop a coherent understanding of a topic or issue.

CCSS.ELA-LITERACY.RH.6-8.7

Integrate visual information (e.g., in charts, graphs, photographs, videos, or maps) with other information in print and digital texts.

Presentation of Knowledge and Ideas:

CCSS.ELA-LITERACY.SL.6.4

Present claims and findings, sequencing ideas logically and using pertinent descriptions, facts, and details to accentuate main ideas or themes; use appropriate eye contact, adequate volume, and clear pronunciation.

CCSS.ELA-LITERACY.SL.6.5

Include multimedia components (e.g., graphics, images, music, sound) and visual displays in presentations to clarify information.

Data Sources for Visualization

Gridded Population
Total, Urban and Rural Counts, Densities and Areas 10,000 B.C. – 2005 A.D.: Klein Goldewijk et al. (2010), Klein Goldewijk et al. (2011)

Gridded Cropland and Pasture Land Use
10,000 B.C. – 2005 A.D.: Klein Goldewijk et al. (2010), Klein Goldewijk et al (2011)

Appropriate for: 6th Grade - 11th Grade
Standards for: 6th Grade, 7th Grade, 8th Grade, 9th Grade, 10th Grade, 11th Grade, 12th Grade
Prep Time: 15 minutes
Activity Time: 120 minutes
Subjects: Obtaining & Evaluating Information, Patterns

Attached Files